

FREE DOWNLOAD: Business Analyst Documentation Toolkit
Get instant access to real-world BRD, FRD, and project story templates used by senior BAs.
Download Free Templates PDFIn software engineering and business analysis, a Process Flow Diagram serves as a foundational visual artifact for mapping operational workflows. By utilizing BPMN 2.0 (Business Process Model and Notation) standards, Business Analysts (BAs) can transform complex business steps into clear, standardized visual models that align business stakeholders, operational teams, and software engineering teams.
Mastering how to create an effective process flow diagrams enables BAs to capture current AS-IS operational states, design optimized TO-BE workflows, and establish explicit functional requirements for system automation.
What Is a Process Flow Diagram in BPMN 2.0?
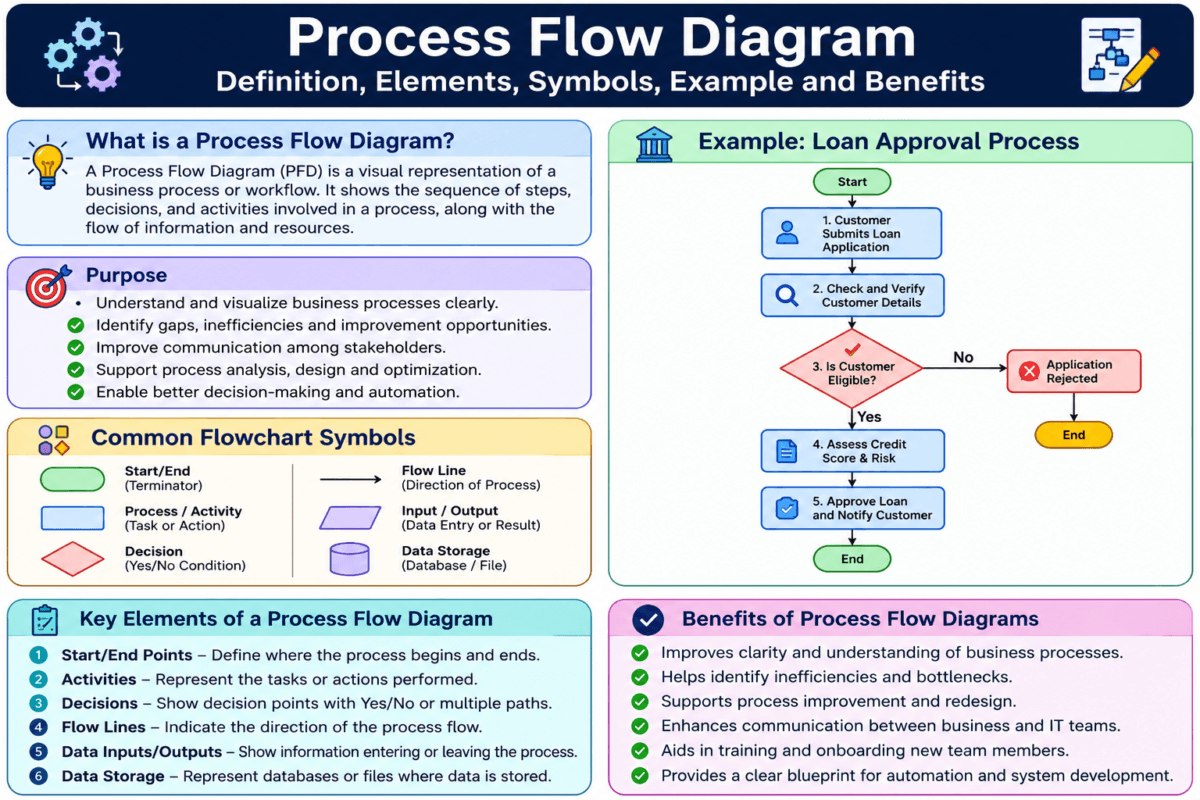
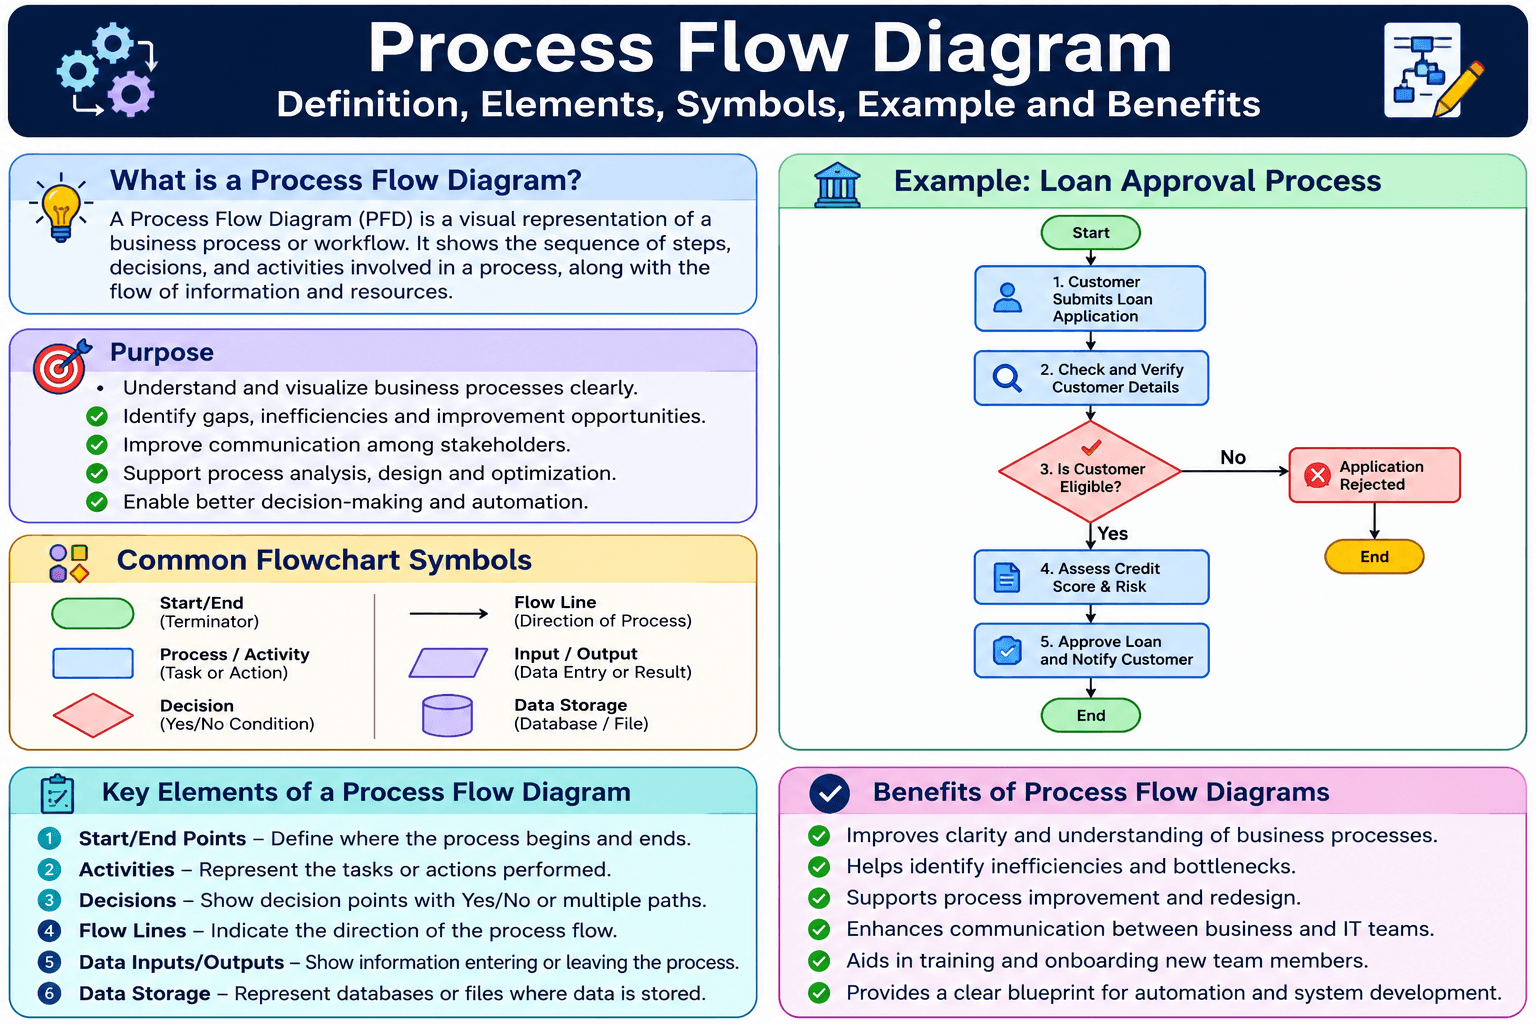
A Process Flow Diagram is a graphical representation depicting the sequential steps, decision points, data transfers, and roles involved in executing a business process from trigger to completion.
While generic flowcharts use basic shapes, professional BAs rely on BPMN 2.0, an open specification maintained by the Object Management Group (OMG). BPMN 2.0 provides a standardized visual language that ensures your process flow diagram is unambiguous and readable across both business and technical domains.
Core Elements of a BPMN 2.0 Process Flow Diagrams
BPMN 2.0 structures a process flow diagram using four main visual categories:
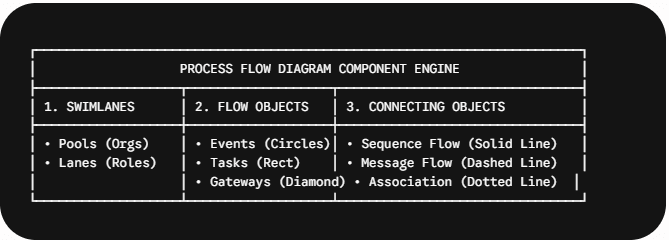
1. Swimlanes (Pools and Lanes)
Pools: Represent distinct organizations, external entities, or independent systems (e.g., Customer Pool, Payment Gateway Pool).
Lanes: Sub-divisions within a Pool that designate specific internal departments, user roles, or microservices (e.g., Sales Rep, Compliance Analyst, Billing Engine).
2. Flow Objects
Events (Circles): Define triggers that occur during process execution:
Start Event: Single thin border (initiates the process flow diagrams).
Intermediate Event: Double border (occurs mid-workflow, such as a 24-hour timer or email receipt).
End Event: Single thick border (marks process completion).
Activities / Tasks (Rounded Rectangles): Represent discrete actions performed by a human or a background system (e.g., Verify Customer ID, Calculate Tax).
Gateways (Diamonds): Control path branching, merging, and decision logic:
Exclusive Gateway (XOR): Evaluates conditions where only one path is taken (e.g., Approved vs. Rejected).
Parallel Gateway (AND): Executes multiple concurrent paths simultaneously (e.g., Send Confirmation Email AND Update Inventory).
Inclusive Gateway (OR): Executes one or more paths depending on meeting specific conditions.
3. Connecting Objects
Sequence Flow (Solid Line with Arrow): Shows the execution order of activities within a single Pool or Lane.
Message Flow (Dashed Line with Open Circle & Arrow): Shows communication signals or data payload transfers between two separate Pools.
AS-IS vs. TO-BE Process Flow Diagram Analysis
During business transformation and requirement gathering, a BA uses process flow diagrams to evaluate operational improvements:
| Aspect | AS-IS Process Flow Diagrams | TO-BE Process Flow Diagrams |
| Focus | Captures existing operational bottlenecks and manual effort | Models proposed optimized workflows and automated steps |
| Primary Goal | Identifies redundancies, processing delays, and compliance gaps | Introduces system integrations, speed, and cost savings |
| Elicitation Source | Created via stakeholder interviews and job shadowing | Derived from business goals, BRDs, and technical requirements |
| Usage | Forms the foundation for Gap Analysis and Business Cases | Serves as the implementation blueprint for developers and QA |
Real-World Scenario: Automated Loan Approval Process Flow Diagram
Context: A commercial bank automates its manual, paper-based personal loan approval process.
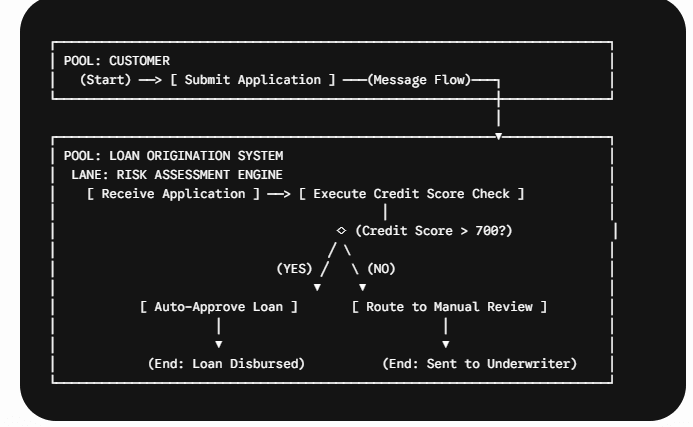
AS-IS Model: Applications were physically reviewed by loan officers, creating a 5-day processing delay.
TO-BE Process Flow Diagram: The BA inserts an Exclusive Gateway following an automated credit check API call. Credit scores above 700 trigger instant approval in under 30 seconds, while lower scores route to a manual underwriter’s queue.
A Process Flow Diagram created using BPMN 2.0 (Business Process Model and Notation) standards is an essential visual artifact used by Business Analysts to map, model, and optimize end-to-end workflows.
By defining Pools, Swimlanes, Events, Tasks, and Decision Gateways, BAs can document AS-IS operational workflows, design automated TO-BE processes, and translate business logic into actionable system specifications.
📄 Business Analysis Documentation Hub
Explore where Process Flow Diagrams fit into requirements engineering, visual modeling, and project execution:
| Knowledge Area | Deep-Dive Article | Why It Matters for a Business Analyst |
|---|---|---|
| Diagramming & Modeling | Process Flow Diagram & BPMN 2.0 Guide | Master workflow mapping, swimlane allocation, decision gateways, and AS-IS vs TO-BE process modeling. |
| Visual Modeling & Diagrams | 5 Steps to Creating an Effective Use Case Diagram | Learn how high-level UML Use Case diagrams complement detailed process flow diagrams during elicitation. |
| Requirements Engineering | What is a Functional Requirement? | Understand how decision paths in process flow diagrams translate into testable functional system requirements. |
| Domain Deep Dives (FinTech) | Enhanced Customer Due Diligence (EDD) | See how process flow diagrams map multi-step compliance onboarding, UBO checks, and escalation workflows. |
| Documentation & Artifacts | Business Analysis Templates & Examples | Access standard templates for BRDs, FRDs, Use Cases, and process documentation artifacts. |
| Software Lifecycles | Understanding the Spiral Life Cycle Model | Explore how process modeling integrates into risk-driven software development lifecycles. |
Frequently Asked Questions (FAQs)
A standard flowchart lacks standardized rules for modeling complex decision logic, message communications, and multi-role assignments. A BPMN 2.0 Process Flow Diagram provides an internationally recognized standard that prevents misinterpretation between business and technical teams.
A Use Case Diagram shows WHO interacts with the system and WHAT features exist at a high level without sequential timing. A Process Flow Diagram details the step-by-step chronological sequence, logic paths, and data flows.
Popular tools include Camunda Modeler, Lucidchart, Draw.io, Signavio, and Microsoft Visio.
🎁 Become a Better Business Analyst
Join 1,200+ Business Analysts learning every week.
Get instant access to:
📘 FREE Business Analyst Templates
🎯 Interview Preparation Guides
🚀 Agile & Scrum Tutorials
🤖 AI for Business Analysts
📈 Career Growth Tips
100% Free • No Spam • Unsubscribe Anytime
