

FREE DOWNLOAD: Business Analyst Documentation Toolkit
Get instant access to real-world BRD, FRD, and project story templates used by senior BAs.
Download Free Templates PDFIn software engineering and business analysis, a UseCase Diagram is a core Unified Modeling Language (UML) artifact that visually captures how external actors interact with a system to achieve specific goals. It establishes system boundaries, defines operational scope, and ensures stakeholders, product owners, and engineering teams share a unified understanding of system functionality.

Key Components of a Use Case Diagram
Before creating a diagram, you must understand its four fundamental structural elements:
System Boundary: A rectangle enclosing all functional Use cases, representing the scope of the application or process being modeled.
Actors: Stick figures placed outside the system boundary representing external entities—such as human users, automated background jobs, external systems, or APIs—that interact with the system.
UseCases: Ovals inside the system boundary representing discrete, value-adding functional actions or features.
Relationships: Lines connecting actors to use cases (Associations) or connecting use cases to each other (
<<include>>for mandatory dependencies and<<extend>>for optional/conditional flows).
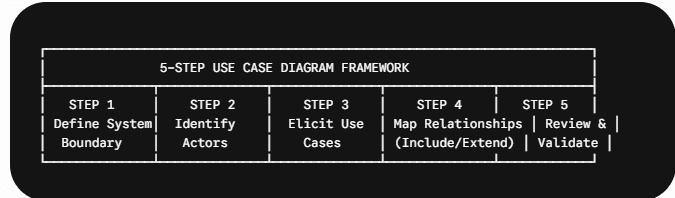
5 Steps to Creating an Effective UseCase Diagram
Step 1: Define the System Boundary
Draw a clear rectangle that delineates what is inside the system scope versus what sits outside. Giving the system boundary a descriptive title (e.g., Online Payment Gateway) prevents scope creep right from the start.
Step 2: Identify Key Actors
List every external entity that directly interacts with the system:
Primary Actors: Initiate an action to fulfill a specific goal (e.g., Customer, Account Holder).
Secondary Actors: Provide support services or receive outputs from the system (e.g., Payment Gateway API, Email Notification Server, Compliance Risk Engine).
Step 3: Elicit and Define the Use Cases
Identify the core goals each actor needs to achieve within the system boundary. Write use cases as strong action-oriented verb-noun phrases:
Good: Process Refund, Verify Identity, Generate Monthly Statement
Avoid: ~Refunds~, ~User Login Screen~, ~System Database~
Step 4: Map Relationships (<<include>> and <<extend>>)
Connect actors to use cases with simple association lines, then define relationships between internal use cases:
<<include>>Relationship: Indicates a mandatory dependency where one UseCase always executes another (e.g., Process Checkout<<include>>Validate Payment Details).<<extend>>Relationship: Indicates an optional or conditional workflow that executes only under specific conditions (e.g., Apply Promo Code<<extend>>Process Checkout).
Step 5: Review, Refine, and Validate with Stakeholders
Walk through the diagram with business stakeholders, developers, and QA leads. Verify that:
The diagram stays high-level and does not try to model complex sequential UI logic (use Activity or Sequence diagrams for flow sequence).
Every UseCase delivers tangible business value to at least one actor.
Real-World Scenario: E-Commerce Checkout System
Context: A Business Analyst is modeling the user interactions for a new retail web application.
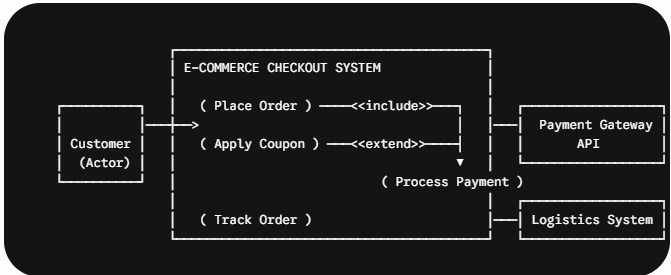
Primary Actor: Customer
Secondary Actors: Payment Gateway API, Logistics System
Key UseCases: Place Order, Apply Coupon, Process Payment, Track Order
Relationship Rules: Place Order unconditionally includes Process Payment. Apply Coupon optionally extends Place Order when a promotion code is entered.
You can review the below articles also.
Frequently Asked Questions (FAQs)
A Use Case Diagram focuses strictly on WHO interacts with the system and WHAT features exist without showing step-by-step sequential order. A Flowchart shows the chronological decision logic and operational execution path.
Yes. Secondary actors are frequently external databases, third-party APIs (such as payment gateways or SMS servers), or automated background daemons.
It should remain high-level. Aim for 5 to 15 use cases per system boundary. If a diagram exceeds 20 use cases, break the system down into sub-system modules to maintain clarity.
A Use Case Diagram is a fundamental UML artifact used by Business Analysts to visualize system boundaries, external actors, functional capabilities, and structural relationships.
Following a 5-step creation framework—defining boundaries, identifying actors, eliciting use cases, mapping include/extend relationships, and validating with stakeholders—ensures clear functional scope before development begins.
📄 Business Analysis Documentation Hub
Explore where Use Case Diagrams fit into requirements engineering, domain modeling, and project delivery:
| Knowledge Area | Deep-Dive Article | Why It Matters for a Business Analyst |
|---|---|---|
| Visual Modeling & Diagrams | 5 Steps to Creating an Effective Use Case Diagram | Master UML modeling, actor identification, system boundary definition, and include/extend relationship mapping. |
| Requirements Engineering | What is a Functional Requirement? | Learn how visual use cases map directly to formal functional requirements and acceptance criteria. |
| Documentation & Artifacts | Business Analysis Templates & Examples | Access standard templates for BRDs, FRDs, Use Case Specifications, and Requirement Traceability Matrices. |
| Domain Deep Dives (FinTech) | Enhanced Customer Due Diligence (EDD) | See how use case models capture complex actor interactions in banking, AML, and KYC onboarding systems. |
| Agile & Delivery Metrics | Understanding Sprint Burndown Chart | Track sprint execution velocity as use-case user stories move from backlog to completed features. |
| Software Lifecycles | Understanding the Spiral Life Cycle Model | Compare iterative use-case prototyping against risk-driven SDLC frameworks in enterprise projects. |
🎁 Become a Better Business Analyst
Join 1,200+ Business Analysts learning every week.
Get instant access to:
📘 FREE Business Analyst Templates
🎯 Interview Preparation Guides
🚀 Agile & Scrum Tutorials
🤖 AI for Business Analysts
📈 Career Growth Tips
100% Free • No Spam • Unsubscribe Anytime

One thought on “How to Create an Effective UseCase Diagram in 5 Steps: A Guide for Business Analysts”