

FREE DOWNLOAD: Business Analyst Documentation Toolkit
Get instant access to real-world BRD, FRD, and project story templates used by senior BAs.
Download Free Templates PDFWhat is an ATM Sequence Diagram?
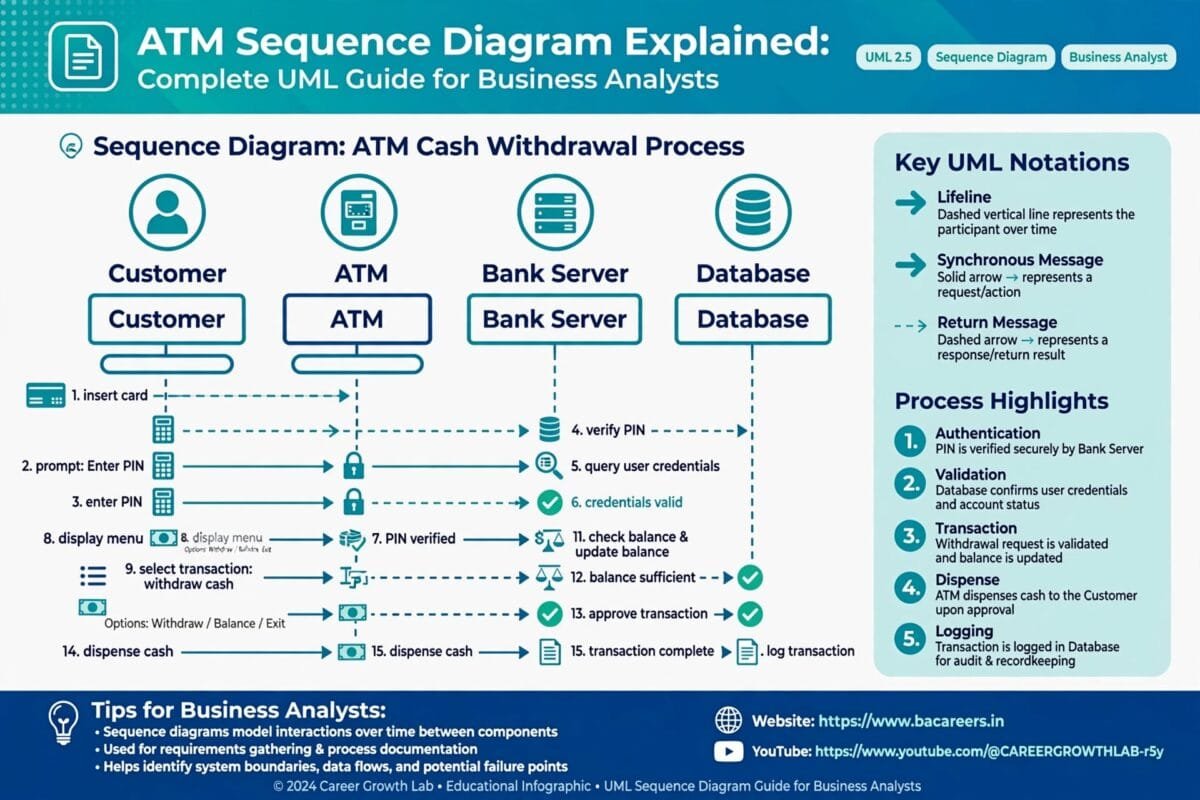
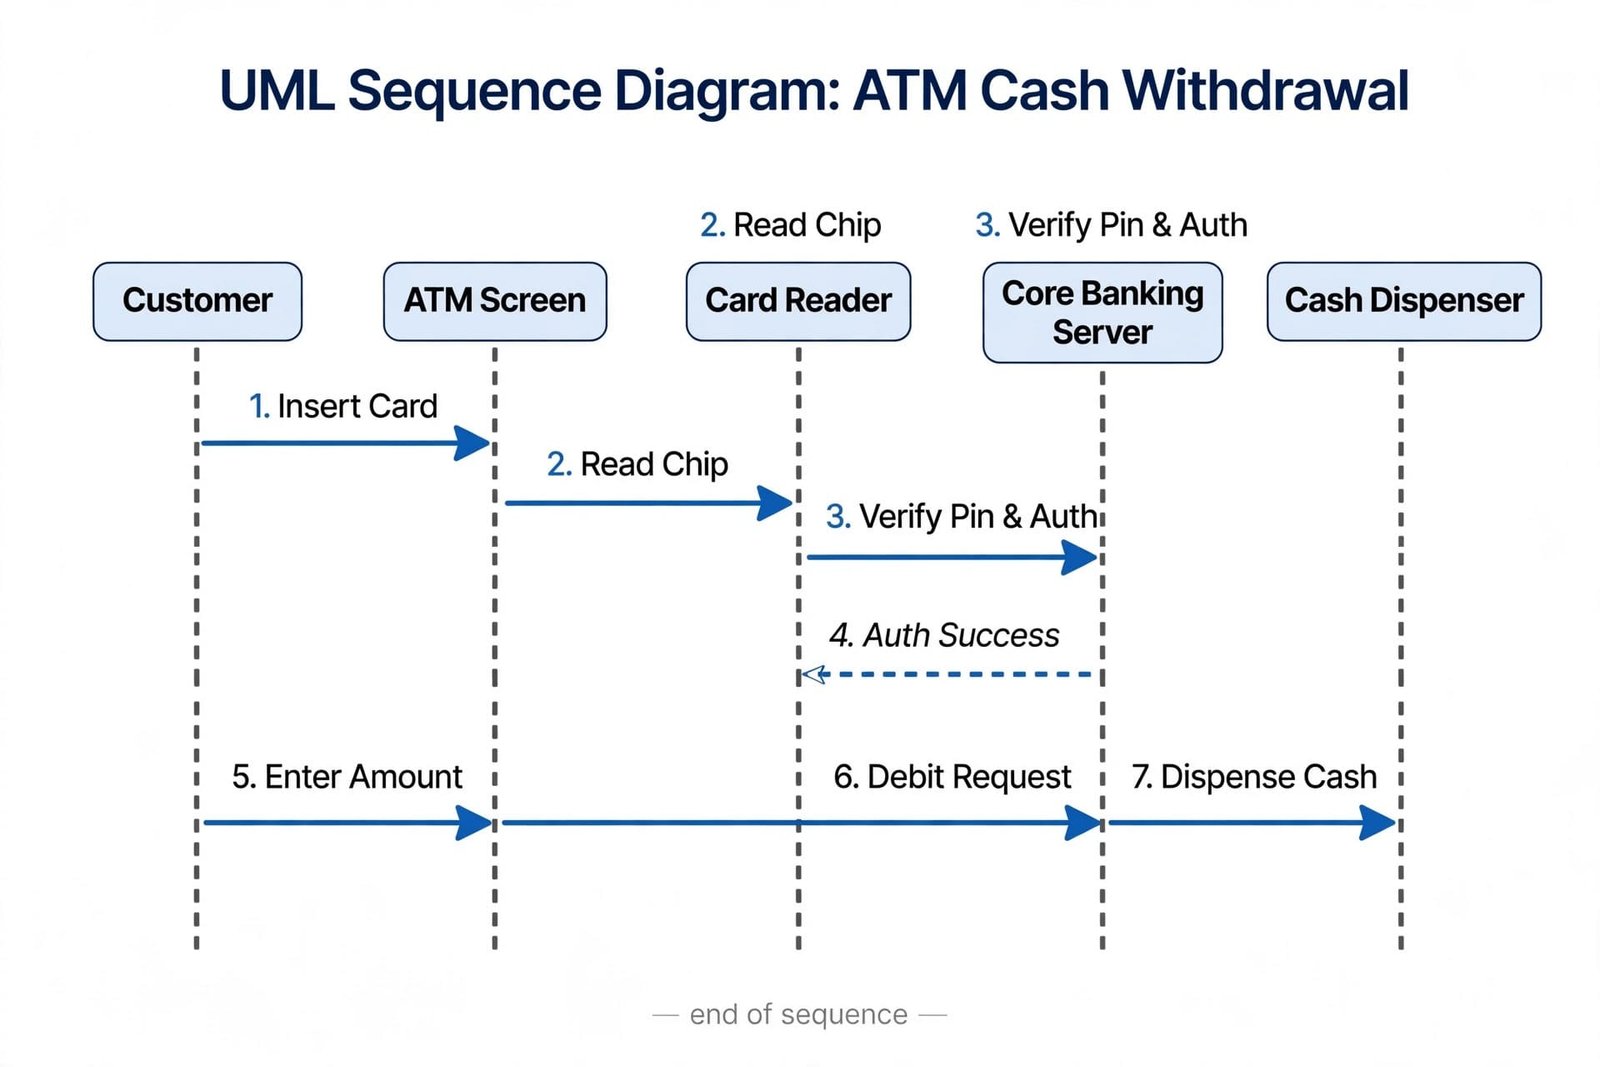
An ATM Sequence Diagram is a dynamic Unified Modeling Language (UML) interaction diagram that illustrates how various system components—such as the User (Customer), ATM Card Reader, ATM Screen, Core Banking Server, and Cash Dispenser—communicate sequentially over time to complete banking transactions like cash withdrawals or balance inquiries.

Key Components of an ATM Sequence Diagram
| Component Name | Visual Symbol | Function in ATM Withdrawal Flow |
| Lifeline | Vertical Dashed Line | Represents individual participating objects or actors across time. |
| Actor | Stick Figure | External user triggering interaction (e.g., Customer or Bank Admin). |
| Activation Box | Thin Vertical Rectangle | Shows the duration during which a system component is actively executing a task. |
| Synchronous Message | Solid Arrow with Solid Head (──►) | Sender waits for a response before proceeding (e.g., PIN Verification). |
| Return Message | Dashed Arrow with Open Head (◄---) | Data returned from recipient back to sender (e.g., Balance Confirmation). |
| Alt Frame (Conditional) | Rectangle Box with alt Label | Models logical branching (e.g., IF PIN is Valid proceed, ELSE Eject Card). |
Step-by-Step Flow: Cash Withdrawal Sequence Diagram
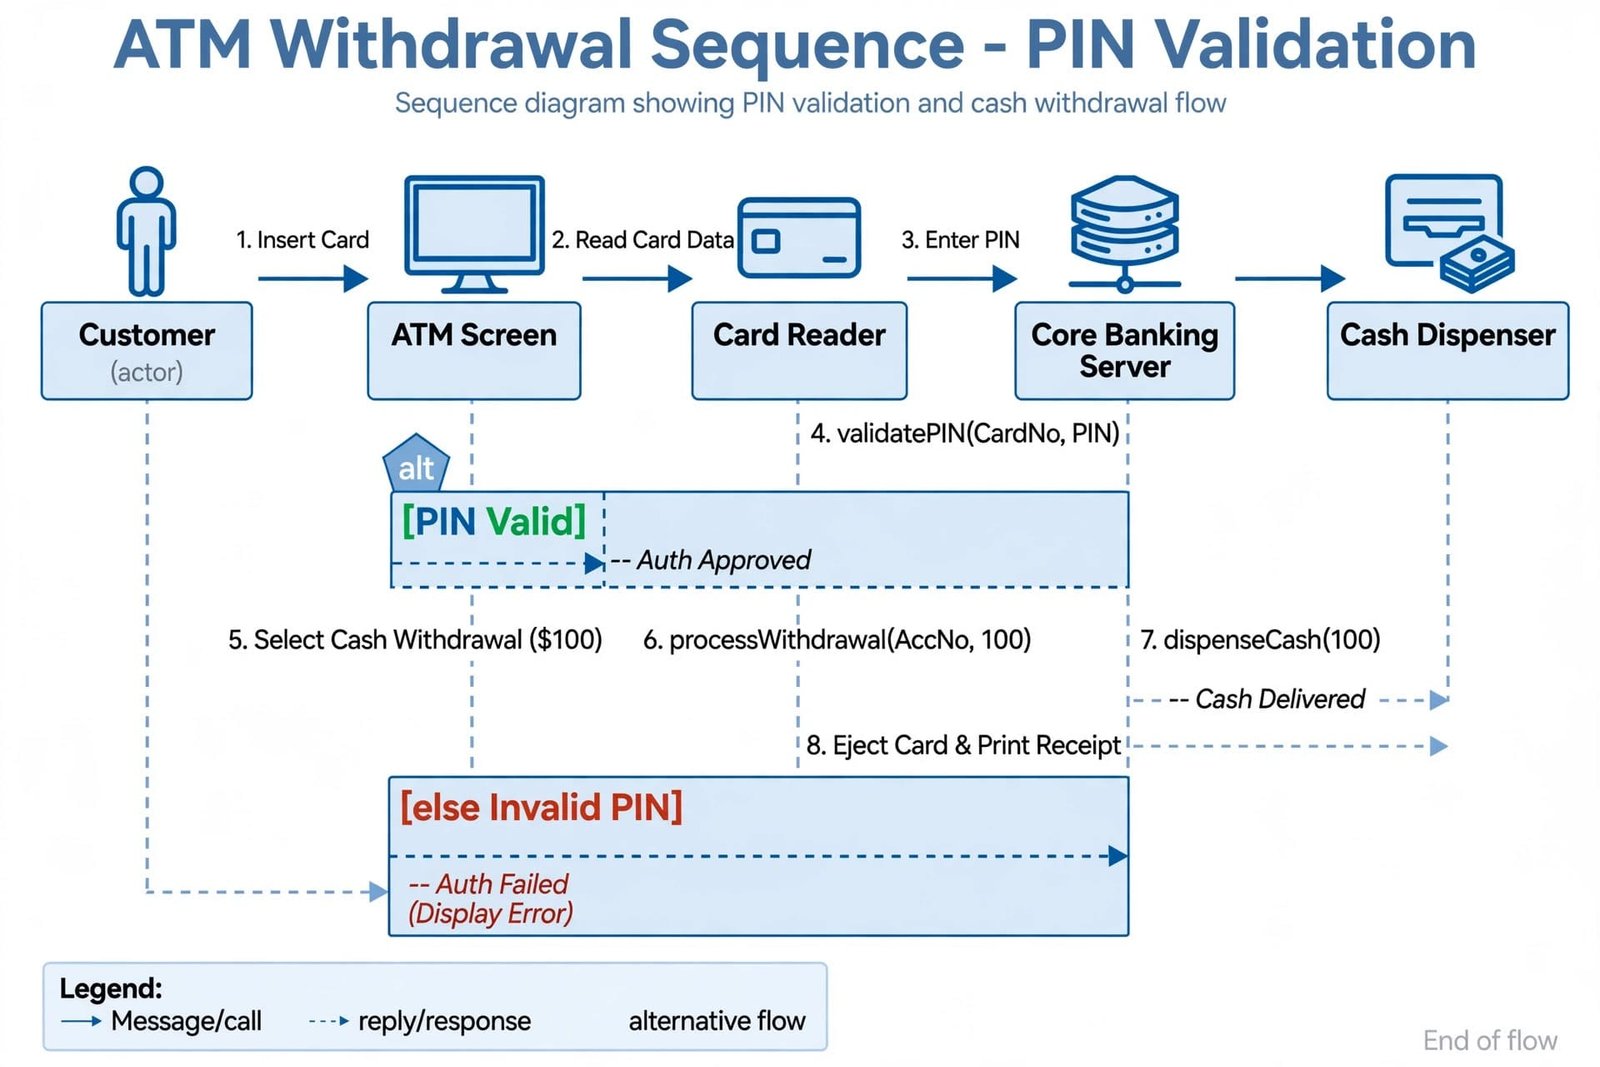
Below is the standard chronological interaction sequence for a successful ATM Cash Withdrawal:
Card Insertion: The Customer inserts the ATM card into the Card Reader.
PIN Entry: The ATM Screen prompts for a 4-digit PIN. The customer inputs the PIN.
Authentication Request: The Card Reader sends a synchronous
validatePIN()message to the Core Banking Server.PIN Validation:
If Valid: Server returns
authSuccessstatus.If Invalid: Server returns
invalidPIN. Screen displays error message and prompts retry (up to 3 attempts).
Transaction Selection: Customer selects Cash Withdrawal and inputs desired amount (e.g., $100).
Balance Check: ATM sends
checkBalanceAndDebit()to the Core Banking Server.Cash Dispense: Once account debit is confirmed, server triggers the Cash Dispenser to drop bills.
Eject & Receipt: Card Reader ejects card, and receipt printer prints statement.
🏦 Real-Time Banking Scenario: Handling Insufficient Funds & Timeout Exceptions
Context & Objective
During peak festival shopping seasons, core banking networks experience high traffic. A Business Analyst must model exception handlings inside the ATM sequence diagram to prevent double-debit errors.
How the Sequence Diagram Handles Exceptions
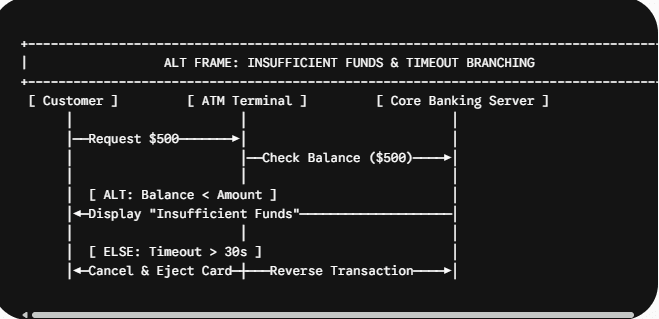
Scenario 1 (Insufficient Funds): If account balance is under $500, the
altlogic block cancels the debit call and sends an immediateinsufficientFundsErrorto the terminal screen.Scenario 2 (Hardware Timeout): If the customer fails to take dispensed cash within 30 seconds, a timer triggers
retractCash(), sends a credit reversal request to the backend server, and locks the dispenser slot to prevent theft.
Comparing ATM Diagrams: Sequence vs. Activity vs. Class vs. State Diagram
| UML Diagram Type | Primary Focus | Best Used For |
| Sequence Diagram | Time & Interaction Order: Shows step-by-step messaging across system objects. | Mapping real-time API messaging between ATM software and Core Banking backends. |
| Activity Diagram | Process Flow & Decisions: Shows swimlanes, decision nodes, and execution branches. | Business process modeling and user flow mapping. |
| Class Diagram | Static Structure: Shows classes, attributes, methods, and relationships. | Object-oriented software architectural engineering (Account, ATM, Transaction). |
| State Machine Diagram | Object State Transitions: Tracks status changes over time. | Modeling ATM hardware hardware states (Idle $\rightarrow$ Card Inserted $\rightarrow$ Dispensing). |
Business Analysis Resource Hub (Internal Links)
📘 UML Diagrams Guide: What is a Use Case Diagram? Complete Guide with Examples — Learn how Use Cases map into Sequence Diagrams.
🛠️ Documentation Blueprint: BRD vs FRD Differences & Real-World Examples — Convert sequence flows into technical FRD functional specifications.
🔄 SDLC Methodology: Waterfall Model in Software Engineering: 6 Phases & BA Role — See where sequence diagrams sit in system design phases.
Sequence Diagram for ATM System
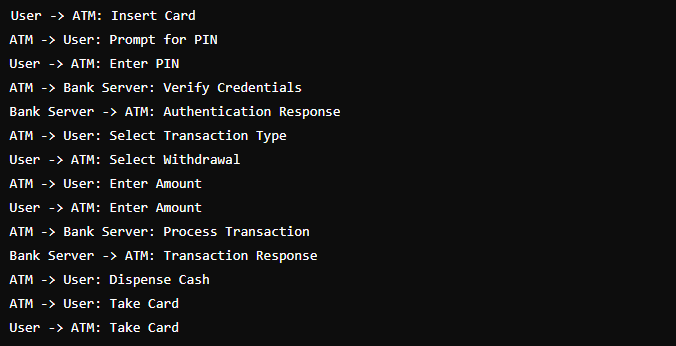
A sequence diagram illustrates how objects interact in a particular scenario of a system. For an ATM system, it captures the interactions between the user, the ATM machine, and the bank server.
ATM Sequence Diagram Example:
- User Authentication:
- The user inserts their card into the ATM.
- The ATM prompts for the PIN.
- The user enters the PIN.
- The ATM sends the card details and PIN to the bank server.
- The bank server verifies the credentials and sends a response back to the ATM.
- Transaction Request:
- The user selects a transaction type (e.g., withdrawal).
- The ATM prompts for transaction details (e.g., amount).
- The user enters the details.
- The ATM sends the transaction request to the bank server.
- The bank server processes the request and updates the account balance.
- The bank server sends a response back to the ATM.
- Transaction Completion:
- The ATM dispenses cash (if withdrawal) or prints a receipt.
- The ATM prompts the user to take their card.
- The user takes the card, and the session ends.
Sample Sequence Diagram:
ATM Activity Diagram
An activity diagram represents the flow of activities in a system. It focuses on the sequence of activities and their conditions.
Sample Activity Diagram:
- Start
- The user inserts their card.
- The user enters their PIN.
- The system validates the PIN.
- If valid, the user proceeds.
- If invalid, the user is prompted to re-enter the PIN or cancel.
- The user selects a transaction type.
- The user enters transaction details.
- The system processes the transaction.
- The system dispenses cash or prints a receipt.
- The user takes their card.
- End

ATM Collaboration Diagram
A collaboration diagram shows the relationships and interactions between objects in a system, emphasizing the structural organization.
Sample Collaboration Diagram:

ATM Class Diagram
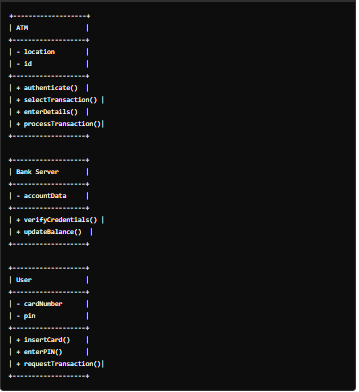
A class diagram illustrates the static structure of a system by showing its classes, attributes, operations, and relationships among objects.
Sample Class Diagram:
A class diagram illustrates the static structure of a system by showing its classes, attributes, operations, and relationships among objects.
Explanation:
- ATM Class: Manages the ATM operations and user interface.
- Bank Server Class: Manages user authentication and transaction processing.
- User Class: Represents the user interacting with the ATM.
Sample Class Diagram:
- ATM Class:
- Attributes: location, id
- Operations: authenticate(), selectTransaction(), enterDetails(), processTransaction()
- Bank Server Class:
- Attributes: accountData
- Operations: verifyCredentials(), updateBalance()
- User Class:
- Attributes: cardNumber, pin
- Operations: insertCard(), enterPIN(), requestTransaction()
ATM State Diagram
A state diagram shows the different states of an object and the transitions between those states.
Sample State Diagram:
A state diagram shows the different states of an object and the transitions between those states.
Explanation:
- The ATM starts in the idle state.
- It transitions to various states such as “Card Inserted,” “PIN Entered,” “Transaction Selected,” “Transaction Processing,” “Transaction Complete,” and “Card Ejected.”
- Idle
- Card Inserted
- PIN Entered
- Transaction Selected
- Transaction Processing
- Transaction Complete
- Card Ejected

Conclusion
Understanding the various diagrams involved in an ATM system is crucial for software engineers. Each diagram provides a different perspective and helps in understanding the system’s functionality and structure better. The sequence diagram focuses on interactions, the activity diagram on workflows, the collaboration diagram on relationships, the class diagram on the static structure, and the state diagram on object states. These diagrams collectively offer a comprehensive view of the ATM system, aiding in its design and implementation.
Frequently Asked Questions (FAQ)
An ATM Sequence Diagram shows the exact chronological order of messages exchanged between various ATM hardware units and backend banking servers during transactions.
A Sequence Diagram focuses on the timing and order of messages passed between system components, whereas an Activity Diagram focuses on high-level workflow steps, decision trees, and user choices.
PIN retry limits are modeled using a combined fragment frame labeled loop (max 3 times) or alt blocks, detailing success vs. failure branches.
🎁 Become a Better Business Analyst
Join 1,200+ Business Analysts learning every week.
Get instant access to:
📘 FREE Business Analyst Templates
🎯 Interview Preparation Guides
🚀 Agile & Scrum Tutorials
🤖 AI for Business Analysts
📈 Career Growth Tips
100% Free • No Spam • Unsubscribe Anytime
