

FREE DOWNLOAD: Business Analyst Documentation Toolkit
Get instant access to real-world BRD, FRD, and project story templates used by senior BAs.
Download Free Templates PDFWhat is a Use Case Diagram?
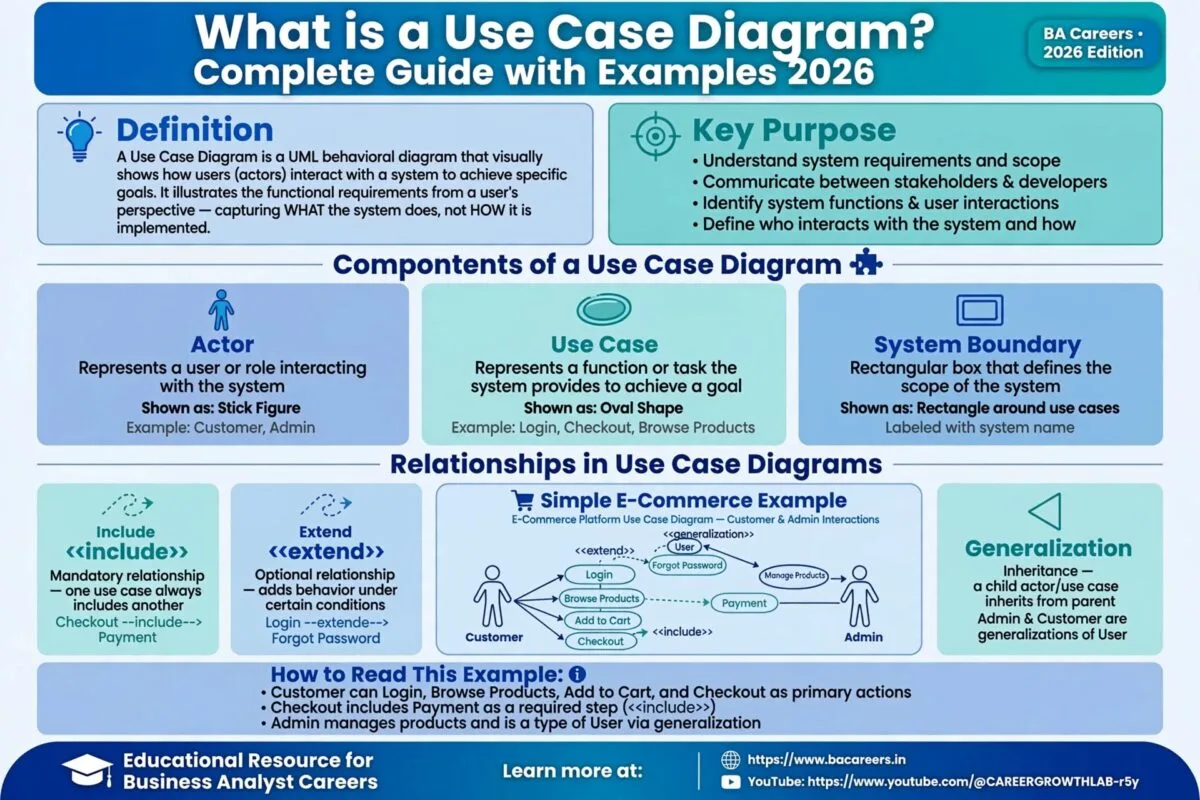
A Use Case Diagram is a high-level Unified Modeling Language (UML) behavioral diagram that visualizes the interactions between external users (Actors) and a system under development to achieve specific business goals.
In business analysis and software engineering, BAs use Use Case Diagrams during requirement gathering to define project scope, establish system boundaries, and illustrate feature interactions without diving into deep code implementation.
4 Essential Components of a Use Case Diagram
| Component | Symbol / Representation | Description | Example |
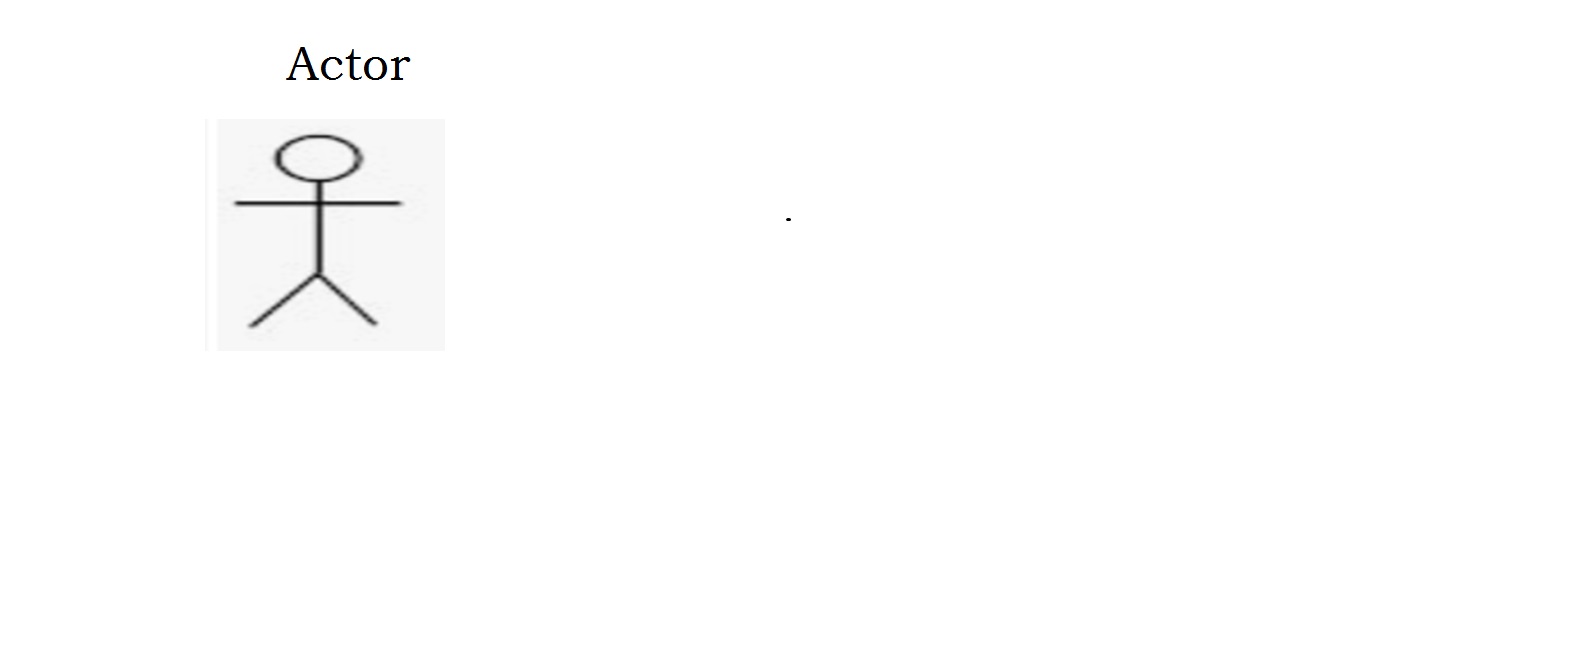
| 1. Actor | Stick Figure | An external entity (person, organization, or third-party system) that interacts with the system. | Customer, Admin, Payment Gateway API. |
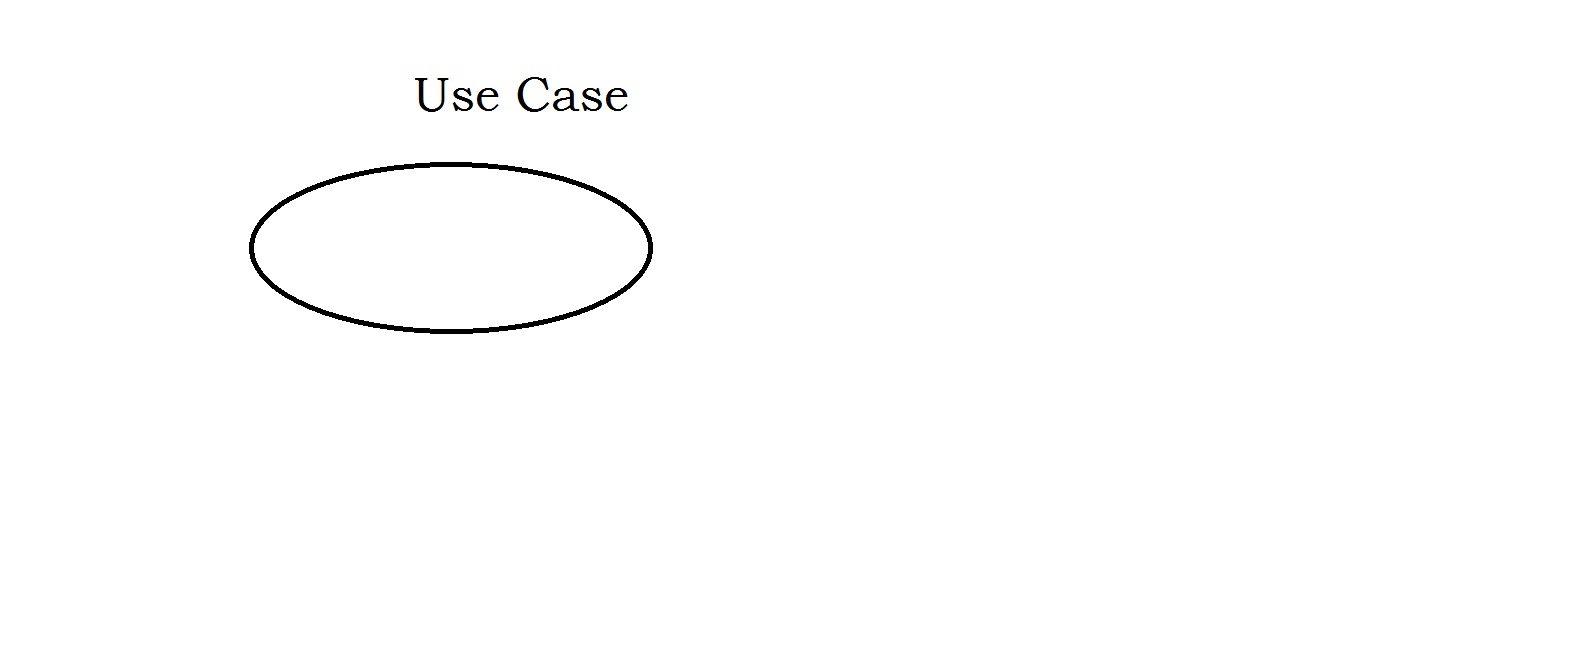
| 2. Use Case | Oval / Ellipse | A specific action or feature function performed within the system to achieve a goal. | Transfer Funds, Generate Invoice, Reset Password. |
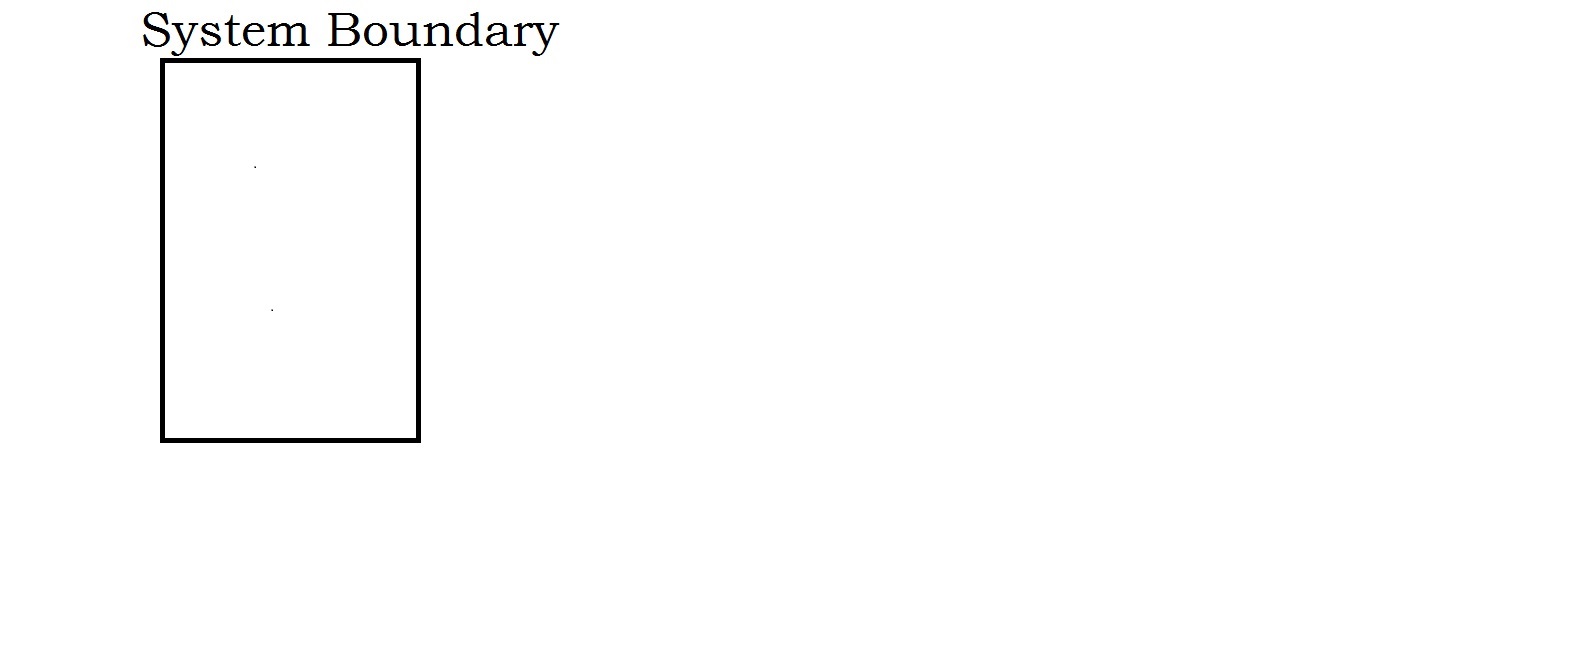
| 3. System Boundary | Rectangle Box | A rectangular enclosure containing all use cases, defining what is inside vs. outside project scope. | Mobile Banking App Boundary. |
| 4. Relationships | Solid or Dashed Lines | Lines showing interactions between actors and use cases or between individual use cases. | Association (—), Include (<<include>>), Extend (<<extend>>). |
Primary vs. Secondary Actors
Understanding actor roles is critical when mapping business requirements:
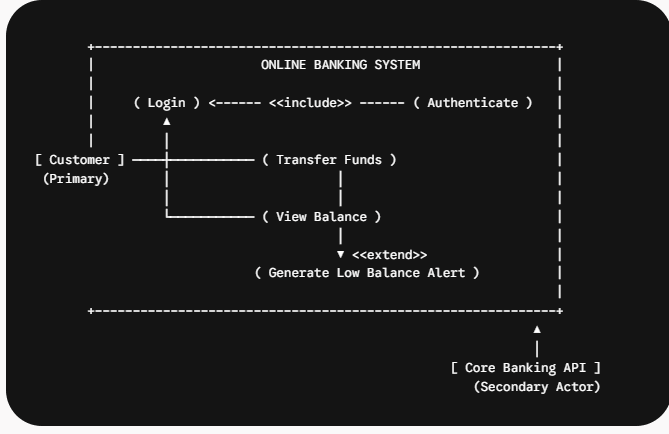
Primary Actor: Initiates the interaction with the system to achieve a goal (e.g., a Customer logging in to transfer money). Placed on the left side of the diagram.
Secondary Actor: Assists the system in fulfilling the primary actor’s request, often by providing backend services (e.g., a Core Banking API or SMS Gateway). Placed on the right side of the diagram.
Relationships in Use Case Diagrams Explained
Association (
—): A solid line connecting an Actor to a Use Case, representing direct communication.Include (
<<include>>): Represents a mandatory sub-step required by a base use case. (Example:Transfer FundsALWAYS includesAuthenticate User).Extend (
<<extend>>): Represents optional or conditional functionality that only executes under specific circumstances. (Example:Transfer FundsextendsGenerate High Value Transaction AlertONLY IF transfer > $10,000).Generalization (
──►): Represents child use cases or actors inheriting properties from a parent. (Example:Credit Card PaymentandNet Banking PaymentgeneralizePayment Method).
🏦 Real-Time Scenario: E-Commerce Order Processing System
Context & Objective
A Business Analyst is defining requirements for an online retail portal’s checkout process. The BA creates a Use Case Diagram to present functional scope to stakeholders, developers, and QA teams.
Diagram Breakdown in Practice
Primary Actors: Registered Customer and Store Admin.
Secondary Actors: Stripe Payment Gateway API and Email Notification Service.
System Boundary: E-Commerce Checkout Engine.
Use Cases inside the Boundary:
Place Order: Triggered by Customer. Includes
Validate Cartmandatory step.Process Payment: Interacts with Stripe Payment Gateway API (Secondary Actor).
Send Order Confirmation: Triggers Email Notification Service.
Apply Discount Code: An
<<extend>>relationship attached to Place Order (executes only if user enters a coupon code).
Why the BA Used This Diagram
By reviewing this single visual diagram during the JAD (Joint Application Design) session, the product team immediately noticed that Refund Processing was missing from the initial scope, avoiding a costly mid-sprint redesign.
How to Draw a Use Case Diagram in 5 Steps
Identify the Project Scope: Draw a rectangle box representing the system boundary.
Identify Primary and Secondary Actors: List all human roles and external systems interacting with the solution.
Identify Key Business Functions (Use Cases): Write actionable verbs inside ovals (View Account, Download Statement).
Establish Relationships: Connect actors to use cases using association lines.
Apply Include & Extend Rules: Add conditional or mandatory relationships between use cases.
🔗 Business Analysis Resource Hub (Internal Links)
📘 Documentation Blueprint: BRD vs FRD Differences & Real-World Examples — Learn how Use Case Diagrams convert into FRD requirements.
🛠️ Waterfall & SDLC: Waterfall Model in Software Engineering: 6 Phases & BA Role — Understand where UML diagrams fit into traditional SDLC phases.
✍️ Agile Requirements: How to Write User Stories with Examples — Transition from Use Case Diagrams to Agile User Stories and Acceptance Criteria.
UseCase diagrams plays very important role, these diagrams help to understand the relationship between user to user and user to system. Like what is the relationship with the user and what are the actions done by the User and how user wants to interact with the system.
The focus of this diagram will be on “how external interfaces” (End users, Support systems, Database and internet connectivity to third party) will be interacting with the Proposed IT System.
Use Case Diagram contains below:
- Use Case will be as below:
2. Actor:
3. Use Case System Boundary.
4. Lines to match the Activity with the user:
Relationships between Actors and Use-Cases
Use-cases could be organized using following relationships −
- Generalization
- Association
- Extend
- Include
Where and Why Use Case Diagrams can be used:
- Describe the functionality of a System
- Describe the user Actions
- Use case diagrams represents only positive flow.
- Should not use for alternate flow, like if any error happens what to be done.
- To describe how user interacts with the system.
- To describe how external interfaces, interact with the proposed system.
- Actor and use case play important role.
- Lines represent the relationship between Actor and Use Case (Oval Shape).
Information which we should not use in use case diagrams.
- Technology Names (Java, .Net Mainframes)
- Brand Names ( Lenovo, Sony etc..)
- Data Base Names (SQL, MySQL, Oracle etc..)
- Networks (LAN, WAN etc.,)
- Architectures (2 Tier, 3 Tier etc..)
- Name of the systems (Laptop/ Desktop)
Actor :
- Actor stay away from the system boundary.
- Primary actor initiates the system to work.
- System depends on secondary actor for information.
- Reusable actors will be placed right side of the system boundary.
How to draw Use Case diagram
- Write all sequence of Actions.
- Differentiate information against Actions.
- Try to find out which actor is performing which action.
- Try to find out some modules with respect to functionality or usage.
- Try to draw the relationships between the identified Actors and use Cases
Once completes the Use case diagram then we will prepare use Case Specification Document. This is also called as Use Case description Document. This document helps to provide the clear picture of the Use Case Diagram.
UseCase Specification document contains below.
- Name of the Use Case
- Description of the Use Case
- Actors
- Primary
- Secondary
- Basic flow
- Pre-Conditions
- Post conditions
- Assumptions
- Dependencies
- Constraints
- Input and output
- Miscellaneous information.
- Alternate Flow.
We can’t tell which use case diagram is correct and which use case diagram is wrong. It depends on the project and stakeholders.
How to Derive Test cases.
- UseCase Diagram
- UseCase Description Document
- UseCase specification document will have, Basic flow, Alternate flow and description of the use cases.
- We can identify the scenarios from these flows.
- Try to identify 3 to 5 valid test data from each scenario.
- Then try to write the test cases from the gathered test data and scenarios.
To Know more about UML Diagrams.
Frequently Asked Questions (FAQ)
A Use Case Diagram shows who interacts with a system and what features exist at a high level. A Flowchart shows the step-by-step sequential execution path and decision logic inside a single process.
<<include>> is a mandatory sub-process that always runs when the base use case executes. <<extend>> is an optional or conditional process that only runs under specific triggering conditions.
Yes. When modeling enterprise software with multiple microservices or distinct modules (e.g., Customer Portal vs. Admin Portal), a BA can draw multiple system boundary boxes in a single master diagram.
🎁 Become a Better Business Analyst
Join 1,200+ Business Analysts learning every week.
Get instant access to:
📘 FREE Business Analyst Templates
🎯 Interview Preparation Guides
🚀 Agile & Scrum Tutorials
🤖 AI for Business Analysts
📈 Career Growth Tips
100% Free • No Spam • Unsubscribe Anytime
