

FREE DOWNLOAD: Business Analyst Documentation Toolkit
Get instant access to real-world BRD, FRD, and project story templates used by senior BAs.
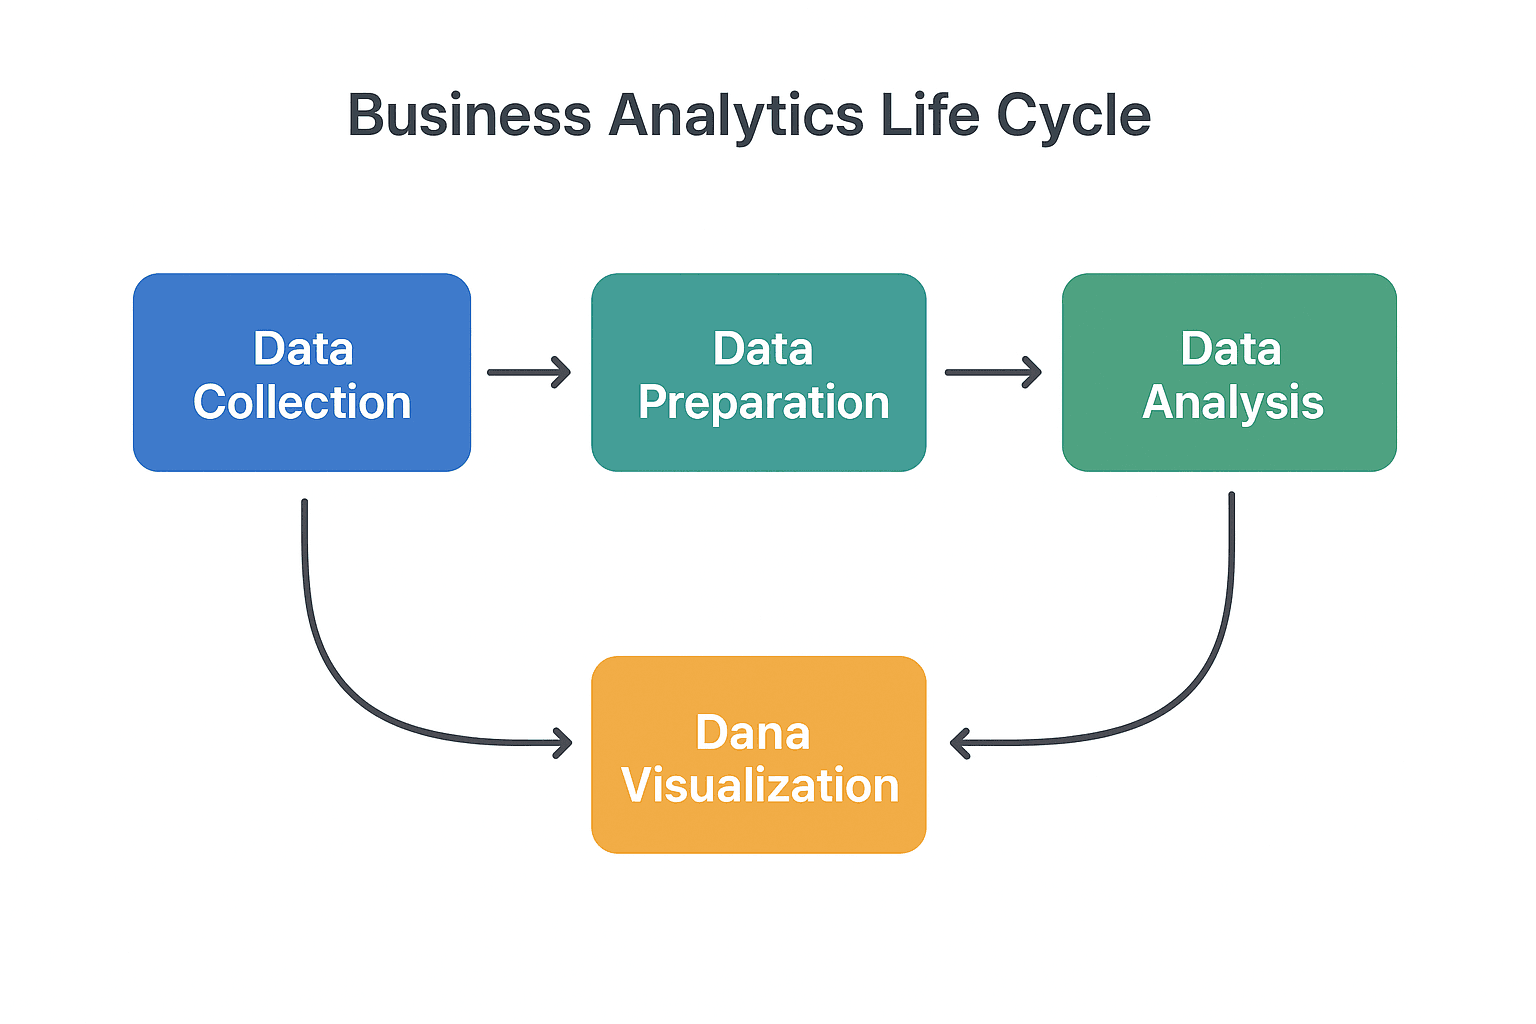
Download Free Templates PDFIn today’s data-driven enterprise, raw data holds little value unless it is systematically gathered, analyzed, and translated into strategic business actions. The Business Analytics Life Cycle is a structured, iterative framework that guides organizations through transforming raw transactional data into actionable commercial insights.
While traditional software development lifecycles (like SDLC or Agile Sprints) focus on building functional software features, the analytics lifecycle focuses on answering complex business questions, discovering patterns, and optimizing decision-making processes.

The 6 Stages of the Business Analytics Life Cycle
┌─────────────────────────────────────────────────────────────────────────┐
│ 1. PROBLEM IDENTIFICATION & GOAL DEFINITION                            │
│ Frame the business objective, defining KPIs and success metrics.        │
└────────────────────────────────────┬────────────────────────────────────┘
                                     │
                                     ▼
┌─────────────────────────────────────────────────────────────────────────┐
│ 2. DATA IDENTIFICATION & ACQUISITION                                    │
│ Locate, extract, and ingest relevant data from internal/external sources.│
└────────────────────────────────────┬────────────────────────────────────┘
                                     │
                                     ▼
┌─────────────────────────────────────────────────────────────────────────┐
│ 3. DATA CLEANING & PREPARATION (Wrangling)                             │
│ Handle missing values, normalize schemas, and validate data quality.    │
└────────────────────────────────────┬────────────────────────────────────┘
                                     │
                                     ▼
┌─────────────────────────────────────────────────────────────────────────┐
│ 4. DATA ANALYSIS & EXPLORATION (EDA)                                    │
│ Apply descriptive, diagnostic, predictive, or prescriptive modeling.    │
└────────────────────────────────────┬────────────────────────────────────┘
                                     │
                                     ▼
┌─────────────────────────────────────────────────────────────────────────┐
│ 5. INSIGHT INTERPRETATION & VISUALIZATION                               │
│ Translate statistical output into business dashboards and reports.      │
└────────────────────────────────────┬────────────────────────────────────┘
                                     │
                                     ▼
┌─────────────────────────────────────────────────────────────────────────┐
│ 6. DEPLOYMENT & DECISION-MAKING                                         │
│ Implement strategy, automate model feeds, and track KPI impact.          │
└─────────────────────────────────────────────────────────────────────────┘
Detailed Stage Breakdown
Stage 1: Problem Identification & Business Understanding
The lifecycle begins not with data, but with a specific business problem or hypothesis. BAs work with executive stakeholders to convert vague complaints into precise analytical questions.
Example Vague Request: “Customer churn seems high this quarter.”
Refined Analytical Question: “Which subscriber segment is exhibiting a >15% monthly drop in login frequency, and what feature interactions correlate with churn prior to contract renewal?”
Stage 2: Data Identification & Collection
Once the problem is defined, analysts map out what data is required, where it resides, and how to extract it safely.
Sources: CRM systems (Salesforce), ERP databases, web analytics (Google Analytics), transactional ledgers, and third-party APIs.
Deep Dive: Read about defining system structures in our guide on Understanding Domain Knowledge.
Stage 3: Data Preparation & Wrangling
Data in raw environments is notoriously messy. This phase accounts for nearly 60–70% of total project effort.
Key Tasks: Deduplication, handling null/missing fields, data type conversion, and setting up primary/foreign key mappings.
Deep Dive: Learn field-level integration in What is Data Mapping.
Stage 4: Exploratory Analysis & Analytics Modeling
Depending on the objective, analysts apply one of the four types of analytics:
| Analytics Type | Question Answered | Example Scenario |
| Descriptive | What happened? | Last month’s total credit card bill payments dropped by 4%. |
| Diagnostic | Why did it happen? | Payment gateway outages during peak hours caused failed transactions. |
| Predictive | What is likely to happen? | Machine learning predicts 12% of users will default next month based on late fee trends. |
| Prescriptive | What action should we take? | Automatically offer a 3-month EMI restructure plan to high-risk users. |
Stage 5: Visualization & Storytelling
Data models and statistical metrics mean little to business executives without narrative framing. BAs design intuitive PowerBI/Tableau dashboards and executive summaries highlighting trends, risks, and ROI.
Stage 6: Deployment, Action, & Monitoring
Insights are translated into operational changes—such as updating sales workflows, refining marketing campaigns, or automating credit checks in core banking software. Models are monitored over time to prevent data drift.
Business Analyst (BA) vs. Data Analyst (DA) in the Lifecycle
While these roles overlap, their focus within the analytics lifecycle differs significantly:
BUSINESS ANALYST (BA)                    DATA ANALYST / DATA SCIENTIST
┌──────────────────────────────┐          ┌──────────────────────────────┐
│ • Focus: Strategy & Business │          │ • Focus: Statistics & Math   │
│ • Key Output: BRD / FRD      │ ◄──────► │ • Key Output: Algorithms     │
│ • Translates business needs  │          │ • Builds predictive models   │
│   into analytical specs      │          │   using Python/R/SQL         │
└──────────────────────────────┘          └──────────────────────────────┘
The Business Analyst leads Stage 1 (Problem Definition) and Stage 6 (Action & Deployment), ensuring the analytical output directly addresses business goals and ROI.
The Data Analyst / Scientist leads Stages 3, 4, and 5 (Preparation, Modeling, and Statistical Scripting).
Real-Time Scenario: E-Commerce Retailer Reducing Shopping Cart Abandonment
1. Business Objective & Problem Statement
An e-commerce platform noticed a 68% shopping cart abandonment rate during peak holiday sales, resulting in estimated revenue losses of $1.2M per month. The leadership commissioned an analytics project to identify the root cause and implement automated recovery mechanisms.
2. Execution of the Analytics Life Cycle
┌─────────────────────────────────────────────────────────────────────────┐
│ STEP 1: HYPOTHESIS & METRIC DEFINITION                                  │
│ BA defines primary KPI: "Cart Checkout Completion Rate".                │
│ Hypothesis: Unexpected shipping costs at step 3 trigger abandonment.    │
└────────────────────────────────────┬────────────────────────────────────┘
                                     │
                                     ▼
┌─────────────────────────────────────────────────────────────────────────┐
│ STEP 2 & 3: DATA EXTRACTION & DATA MAPPING                              │
│ Merged web clickstream logs (Mixpanel) with user profile databases      │
│ and payment gateway logs using SQL joins and field-level mapping.       │
└────────────────────────────────────┬────────────────────────────────────┘
                                     │
                                     ▼
┌─────────────────────────────────────────────────────────────────────────┐
│ STEP 4: DIAGNOSTIC & PREDICTIVE ANALYSIS                                │
│ Discovery: 74% of abandonments occurred on the payment selection page   │
│ when shipping charges exceeded 10% of total cart value.                 │
└────────────────────────────────────┬────────────────────────────────────┘
                                     │
                                     ▼
┌─────────────────────────────────────────────────────────────────────────┐
│ STEP 5 & 6: DECISION DEPLOYMENT & AUTOMATION                            │
│ Action: Implemented dynamic free-shipping threshold prompts during      │
│ checkout and triggered automated push notifications within 15 minutes.  │
└─────────────────────────────────────────────────────────────────────────┘
3. Measurable Outcome
Cart completion increased by 18%, recovering $340,000 in monthly recurring revenue.
Business Analytics & BA Competencies – Knowledge Hub
Below is the structured Knowledge Area matrix connecting analytics frameworks, documentation deliverables, and project execution methodologies:
| Knowledge Area | Deep-Dive Article | Why It Matters for a Business Analyst |
| Analytics & Data Mapping | What is Data Mapping | Critical skill for Stage 3 (Data Preparation), ensuring fields line up across databases. |
| Understanding Domain Knowledge | Essential for Stage 1 (Problem Definition) to ask the right business questions. | |
| Requirements Documentation | BRD Full Form and Template | Shows how BAs document analytical project requirements for data science teams. |
| Difference Between BRD and FRD | Clarifies business objectives versus granular reporting/technical requirements. | |
| Documents Prepared by Business Analyst | Master inventory of project deliverables across analytical and software projects. | |
| Frameworks & Delivery | Agile BA Tools with Real-Time Scenarios | Explains how to manage data analytics sprints using Jira, Miro, and Confluence. |
| Business Analyst Role in Product Companies | Explains how product BAs leverage business analytics to drive feature backlogs. | |
| Testing & Quality Assurance | UAT Meaning and Importance | Guides BAs on validating business dashboards and data pipeline accuracy with stakeholders. |
| Defect Management Guide | Helps BAs identify, track, and resolve data discrepancy bugs during deployment. |
Related Articles :
Data Modeling challenges / Data Mapping Challenges
Best data analytics Software For Data Analysts
The 19 Best Data Visualization Tools and Software for 2022
Frequently Asked Questions (FAQ)
SDLC (Software Development Life Cycle) focuses on designing, building, testing, and deploying software applications or system features. The Business Analytics Life Cycle focuses on processing data, discovering operational insights, and making data-informed commercial decisions.
Common tools include SQL (data extraction), Python/R (data cleaning and modeling), Tableau/Power BI (data visualization), and Jira/Confluence (requirement tracking and documentation).
🎁 Become a Better Business Analyst
Join 1,200+ Business Analysts learning every week.
Get instant access to:
📘 FREE Business Analyst Templates
🎯 Interview Preparation Guides
🚀 Agile & Scrum Tutorials
🤖 AI for Business Analysts
📈 Career Growth Tips
100% Free • No Spam • Unsubscribe Anytime

Thank You.
Thank You.
Thank You.