


How to Create Burndown Chart in Jira
In Agile software delivery, tracking iteration progress in real time is critical to achieving sprint goals. Jira, Atlassian’s enterprise issue-tracking platform, provides built-in reporting features to automatically generate Sprint Burndown Charts.
For Business Analysts (BAs), Product Owners, and Scrum Masters, knowing how to set up, configure, and analyze a Burndown Chart in Jira helps prevent sprint bottlenecks, identify scope creep, and keep the team aligned.

Prerequisites for Creating a Burndown Chart in Jira
Before Jira can generate an accurate Burndown Chart, your project board and backlog must satisfy three core configuration settings:
Scrum Board Setup: Burndown charts are natively available for Scrum boards (Kanban boards track lead and cycle time via Cumulative Flow Diagrams instead).
Estimation Metric Configured: Your board settings must define an estimation statistic (e.g., Story Points, Original Time Estimate, or Issue Count).
Active Sprint: A sprint must be formally started with committed backlog items assigned to it.
Step-by-Step Guide: How to Generate a Burndown Chart in Jira
Step 1: Set Up Estimation Statistics in Board Settings
Navigate to your Jira Scrum Project.
In the top-right corner, click Board Settings (or the
...menu $\rightarrow$ Board settings).Select Estimation from the left navigation panel.
Set the Estimation Statistic field:
Select Story Points (most common for Agile teams) or Original Time Estimate / Issue Count.
Save changes.
Step 2: Estimate Backlog Items & Start the Sprint
Go to the Backlog view.
Ensure every user story pulled into the upcoming sprint has an estimated value in the Story Points field.
Click Start Sprint, set the Sprint Name, Duration (e.g., 2 weeks), and Sprint Goal.
Confirm to make the sprint active.
Step 3: Access the Burndown Chart Report
On the left sidebar menu of your Jira project, click on Reports.
Select Burndown Chart from the Agile reports section.
Use the Sprint dropdown menu at the top of the report screen to select your current active sprint (or a past completed sprint for retro analysis).
How to Read Jira’s Burndown Chart Elements
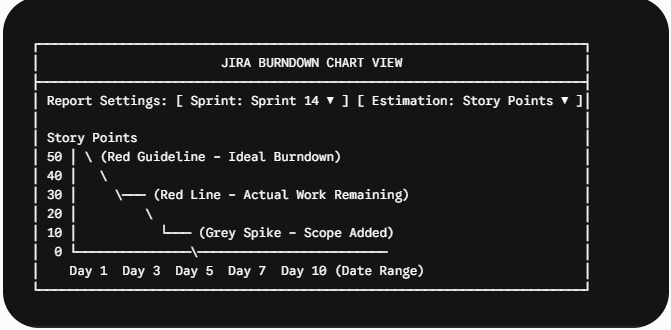
Jira uses specific color codes and visual indicators to represent work progress:
Red Line (Guideline): Shows the ideal linear progress needed to complete all committed work by the end of the sprint.
Red Line (Actual): Represents the actual total remaining story points or estimated hours remaining.
Grey Vertical Area / Line: Indicates scope changes—when issues are added to or removed from the active sprint after it has started.
Burndown Table (Below Chart): Details every event log entry, including issue keys, event types (Issue Added, Status Changed, Estimation Updated), and exact timestamps.
Common Scenarios & Troubleshooting Jira Burndown Charts
| Chart Trajectory | What It Means in Jira | BA / Scrum Master Action |
| Sharp Upward Spike (Grey/Red) | Scope creep—new user stories were added mid-sprint. | Check Jira event log; negotiate swapping out unstarted stories with the Product Owner. |
| Flat Horizontal Line | No issues were moved to “Done” status. | Verify developers are moving Jira cards across board columns or check for team blockers. |
| Drop to Zero on Day 1 | Estimation statistic was set after the sprint started. | Ensure story point estimates are entered before clicking “Start Sprint.” |
| Actual Line Stays Above Ideal | Team is burning down work slower than estimated. | Evaluate task complexity during daily standups; assist with backlog breakdown. |
Real-World Scenario: Catching Scope Creep in Jira
Context: A team is building an E-Commerce Checkout Service with a 40-Story-Point sprint commitment.
Day 3: The Product Owner adds two new payment validation stories (8 Story Points total) directly into the active sprint board.
Jira Impact: The Burndown Chart displays a grey vertical line and a sharp upward spike in remaining story points to 48.
Resolution: The BA opens the Jira Burndown event table below the chart, identifies the added issue IDs (
PAY-104andPAY-105), and coordinates a backlog swap during the daily standup to keep sprint commitments realistic.
Creating a Burndown Chart in Jira allows Agile teams to visually monitor remaining sprint work, track daily progress against an ideal velocity baseline, and manage scope creep in real time.
By properly configuring Estimation Statistics (such as Story Points or Original Time Estimates) in Jira Scrum board settings, Business Analysts and Scrum Masters can automatically generate burndown reports for active sprints.
📄 Business Analysis Documentation Hub
Explore where Jira Burndown Charts fit into the complete software delivery lifecycle:
| Knowledge Area | Deep-Dive Article | Why It Matters for a Business Analyst |
|---|---|---|
| Agile Practical Tooling | How to Create Burndown Chart in Jira | Step-by-step practical tutorial on configuring estimation statistics, sprint boards, and burndown reports in Jira. |
| Agile & Delivery Metrics | Understanding Sprint Burndown Chart | Master tracking sprint progress, team velocity, and backlog execution in Scrum frameworks. |
| Agile Frameworks | Significance of Burndown Chart in Scrum | Learn why burndown charts are essential for sprint tracking, daily standups, and Scrum team alignment. |
| Practical Examples | Burndown Chart Real-World Examples | Explore step-by-step visual examples and scenarios of ideal vs actual progress trajectories. |
| Step-by-Step Guides | Burndown Chart: How to Create Step-by-Step | Comprehensive guide on calculating story points, setting up baselines, and plotting burndown charts manually or automatically. |
| Requirements Engineering | SRS Full Form in Software Engineering | Learn how technical requirements and sprint backlogs are derived from Software Requirements Specifications. |
| Software Lifecycles | Waterfall Methodology in Software Development | Compare linear milestone tracking in traditional SDLC against iterative burndown metrics in Agile. |
Frequently Asked Questions (FAQs)
This occurs if the Estimation Statistic in your Board Settings is set to “None” or if story point fields were populated after starting the sprint. Ensure estimation is enabled and values are set during Sprint Planning.
Yes. Go to Board Settings $\rightarrow$ Estimation and set the Estimation Statistic to Original Time Estimate.
No. In Jira, remaining work only burns down when an issue is moved to a column mapped to the Done status category.
🎁 Become a Better Business Analyst
Join 1,200+ Business Analysts learning every week.
Get instant access to:
📘 FREE Business Analyst Templates
🎯 Interview Preparation Guides
🚀 Agile & Scrum Tutorials
🤖 AI for Business Analysts
📈 Career Growth Tips
100% Free • No Spam • Unsubscribe Anytime

Thank You. No issue from our end.
Thank You.
Thank You.
Articles prepared and shared by me.
Thank you for your feedback.